
You’ve done
the hard work.
It’s time to drop some jaws.
Transform years of research into visual stories
that make reviewers, funders, and audiences
stop scrolling and start paying attention.
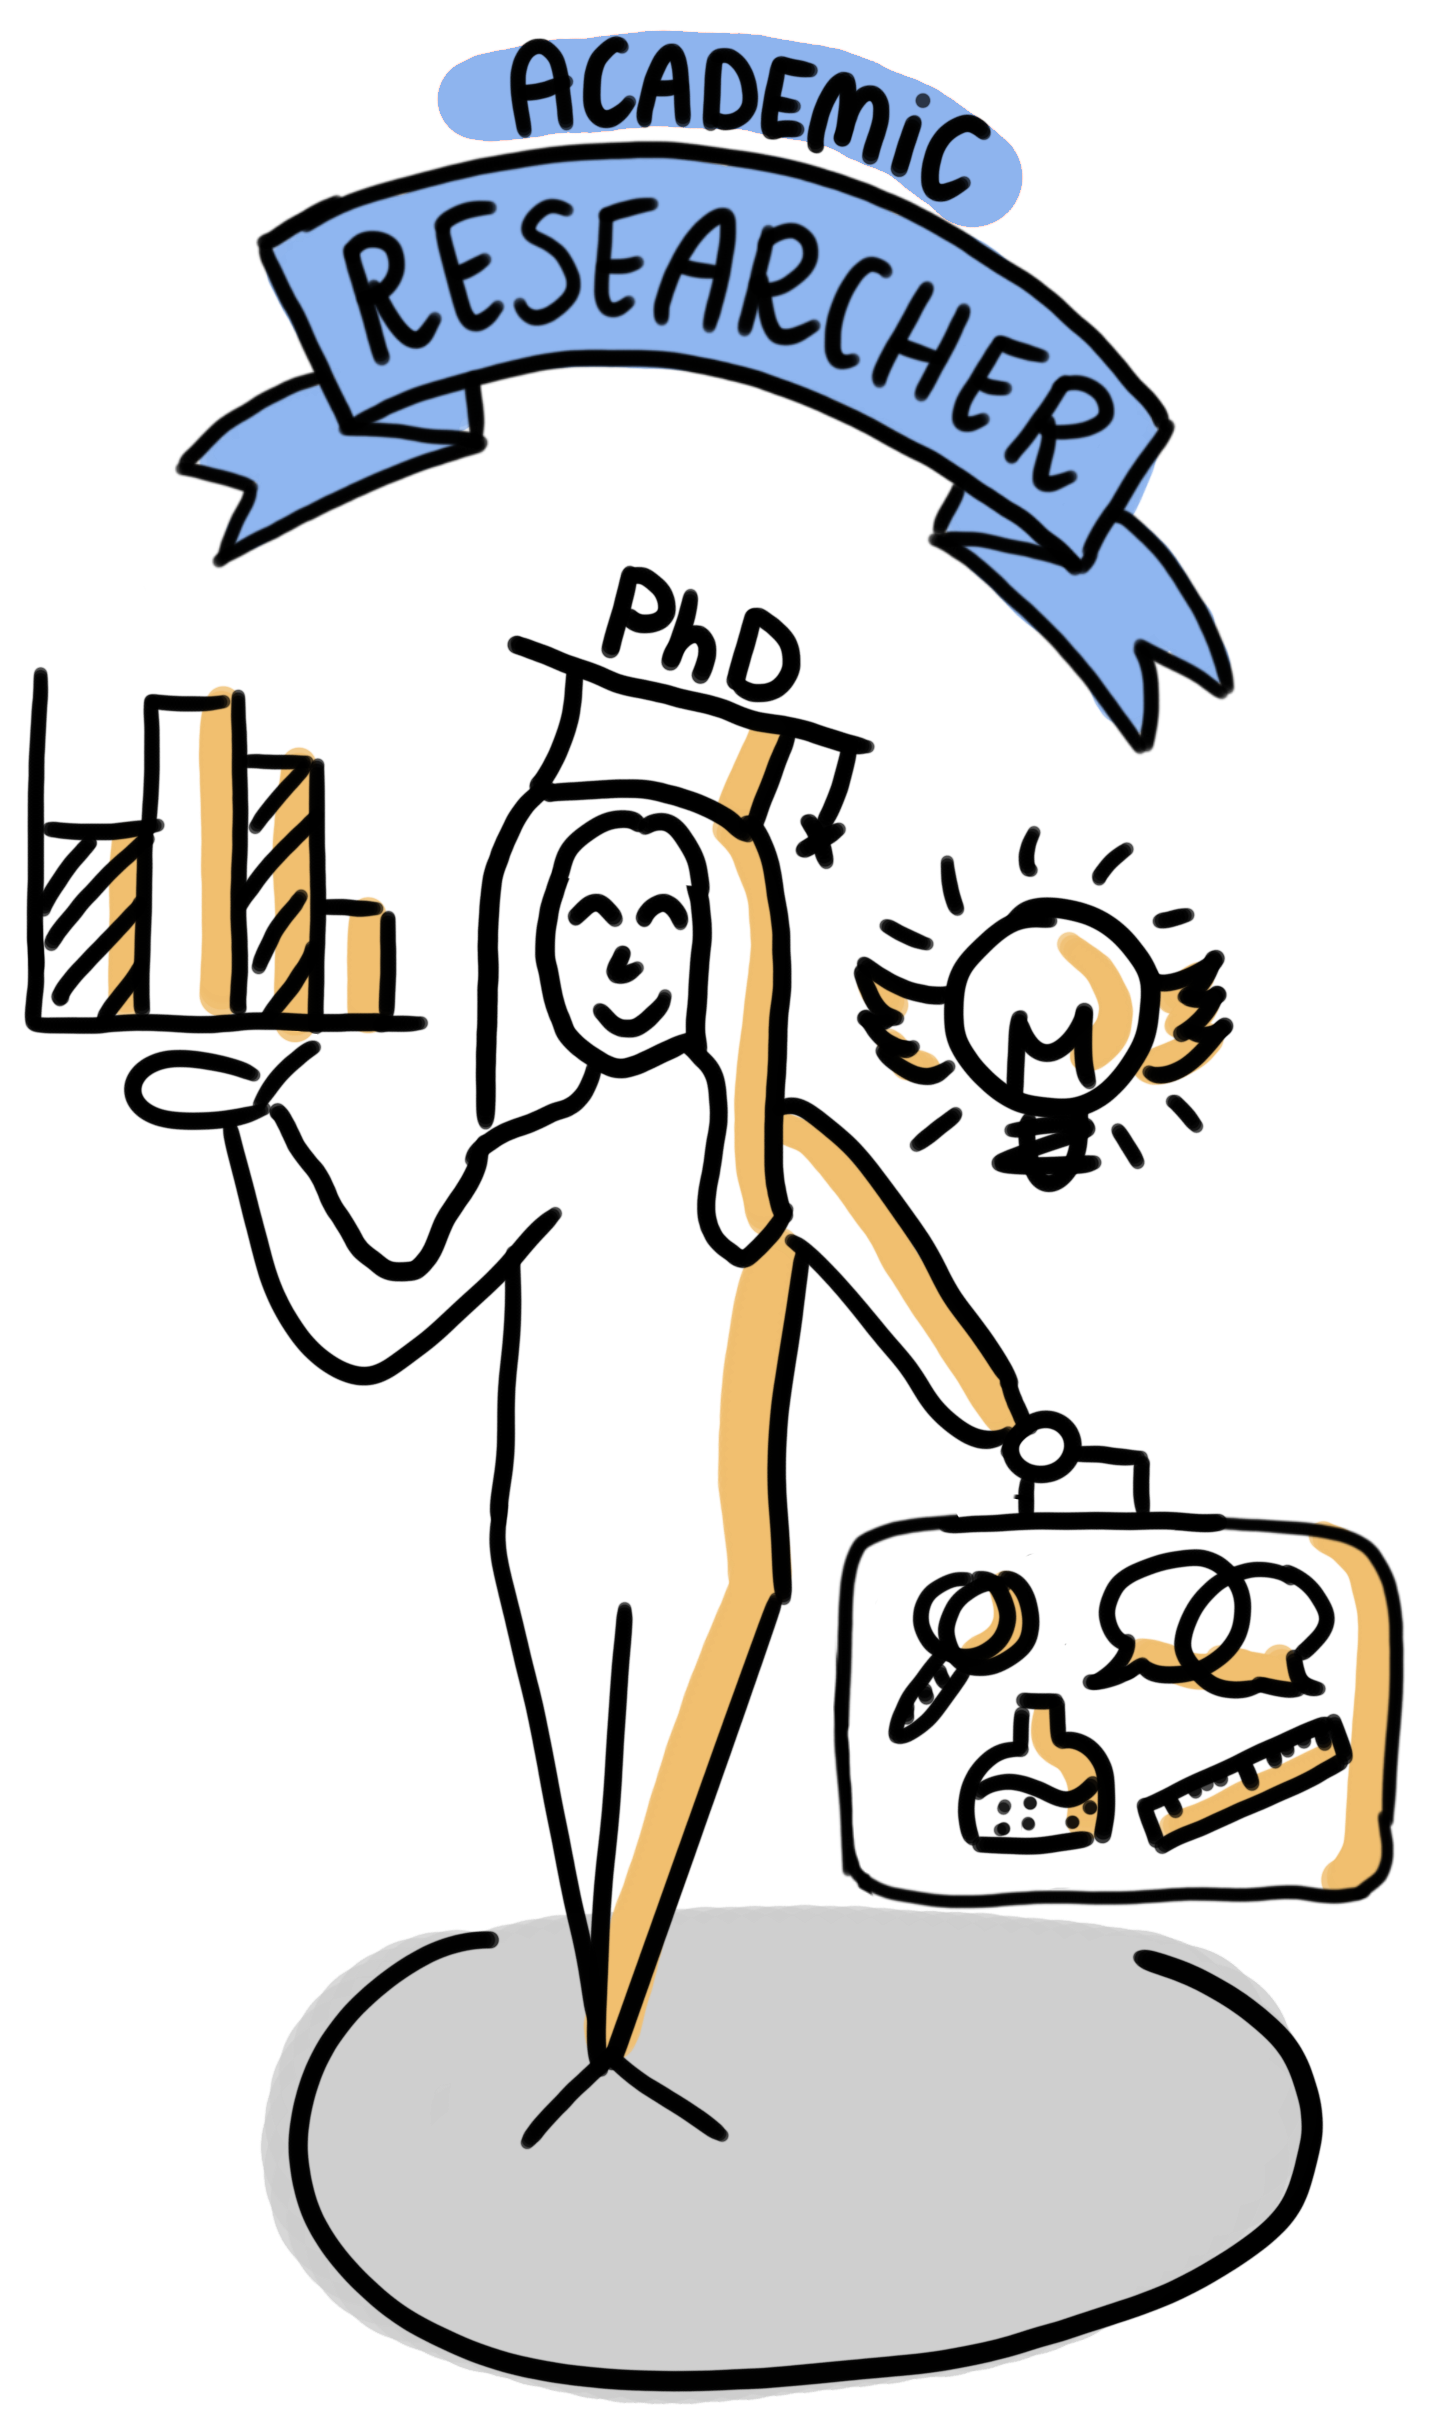
My name is Marta Wronska.
I’m a science communication and visual thinking consultant, with a PhD from the University of Groningen in the Netherlands on the psychology of creative thinking. I help researchers bridge the gap between nerdy brilliance and real-world recognition through hand-drawn storytelling.
What about you?
Let me guess…
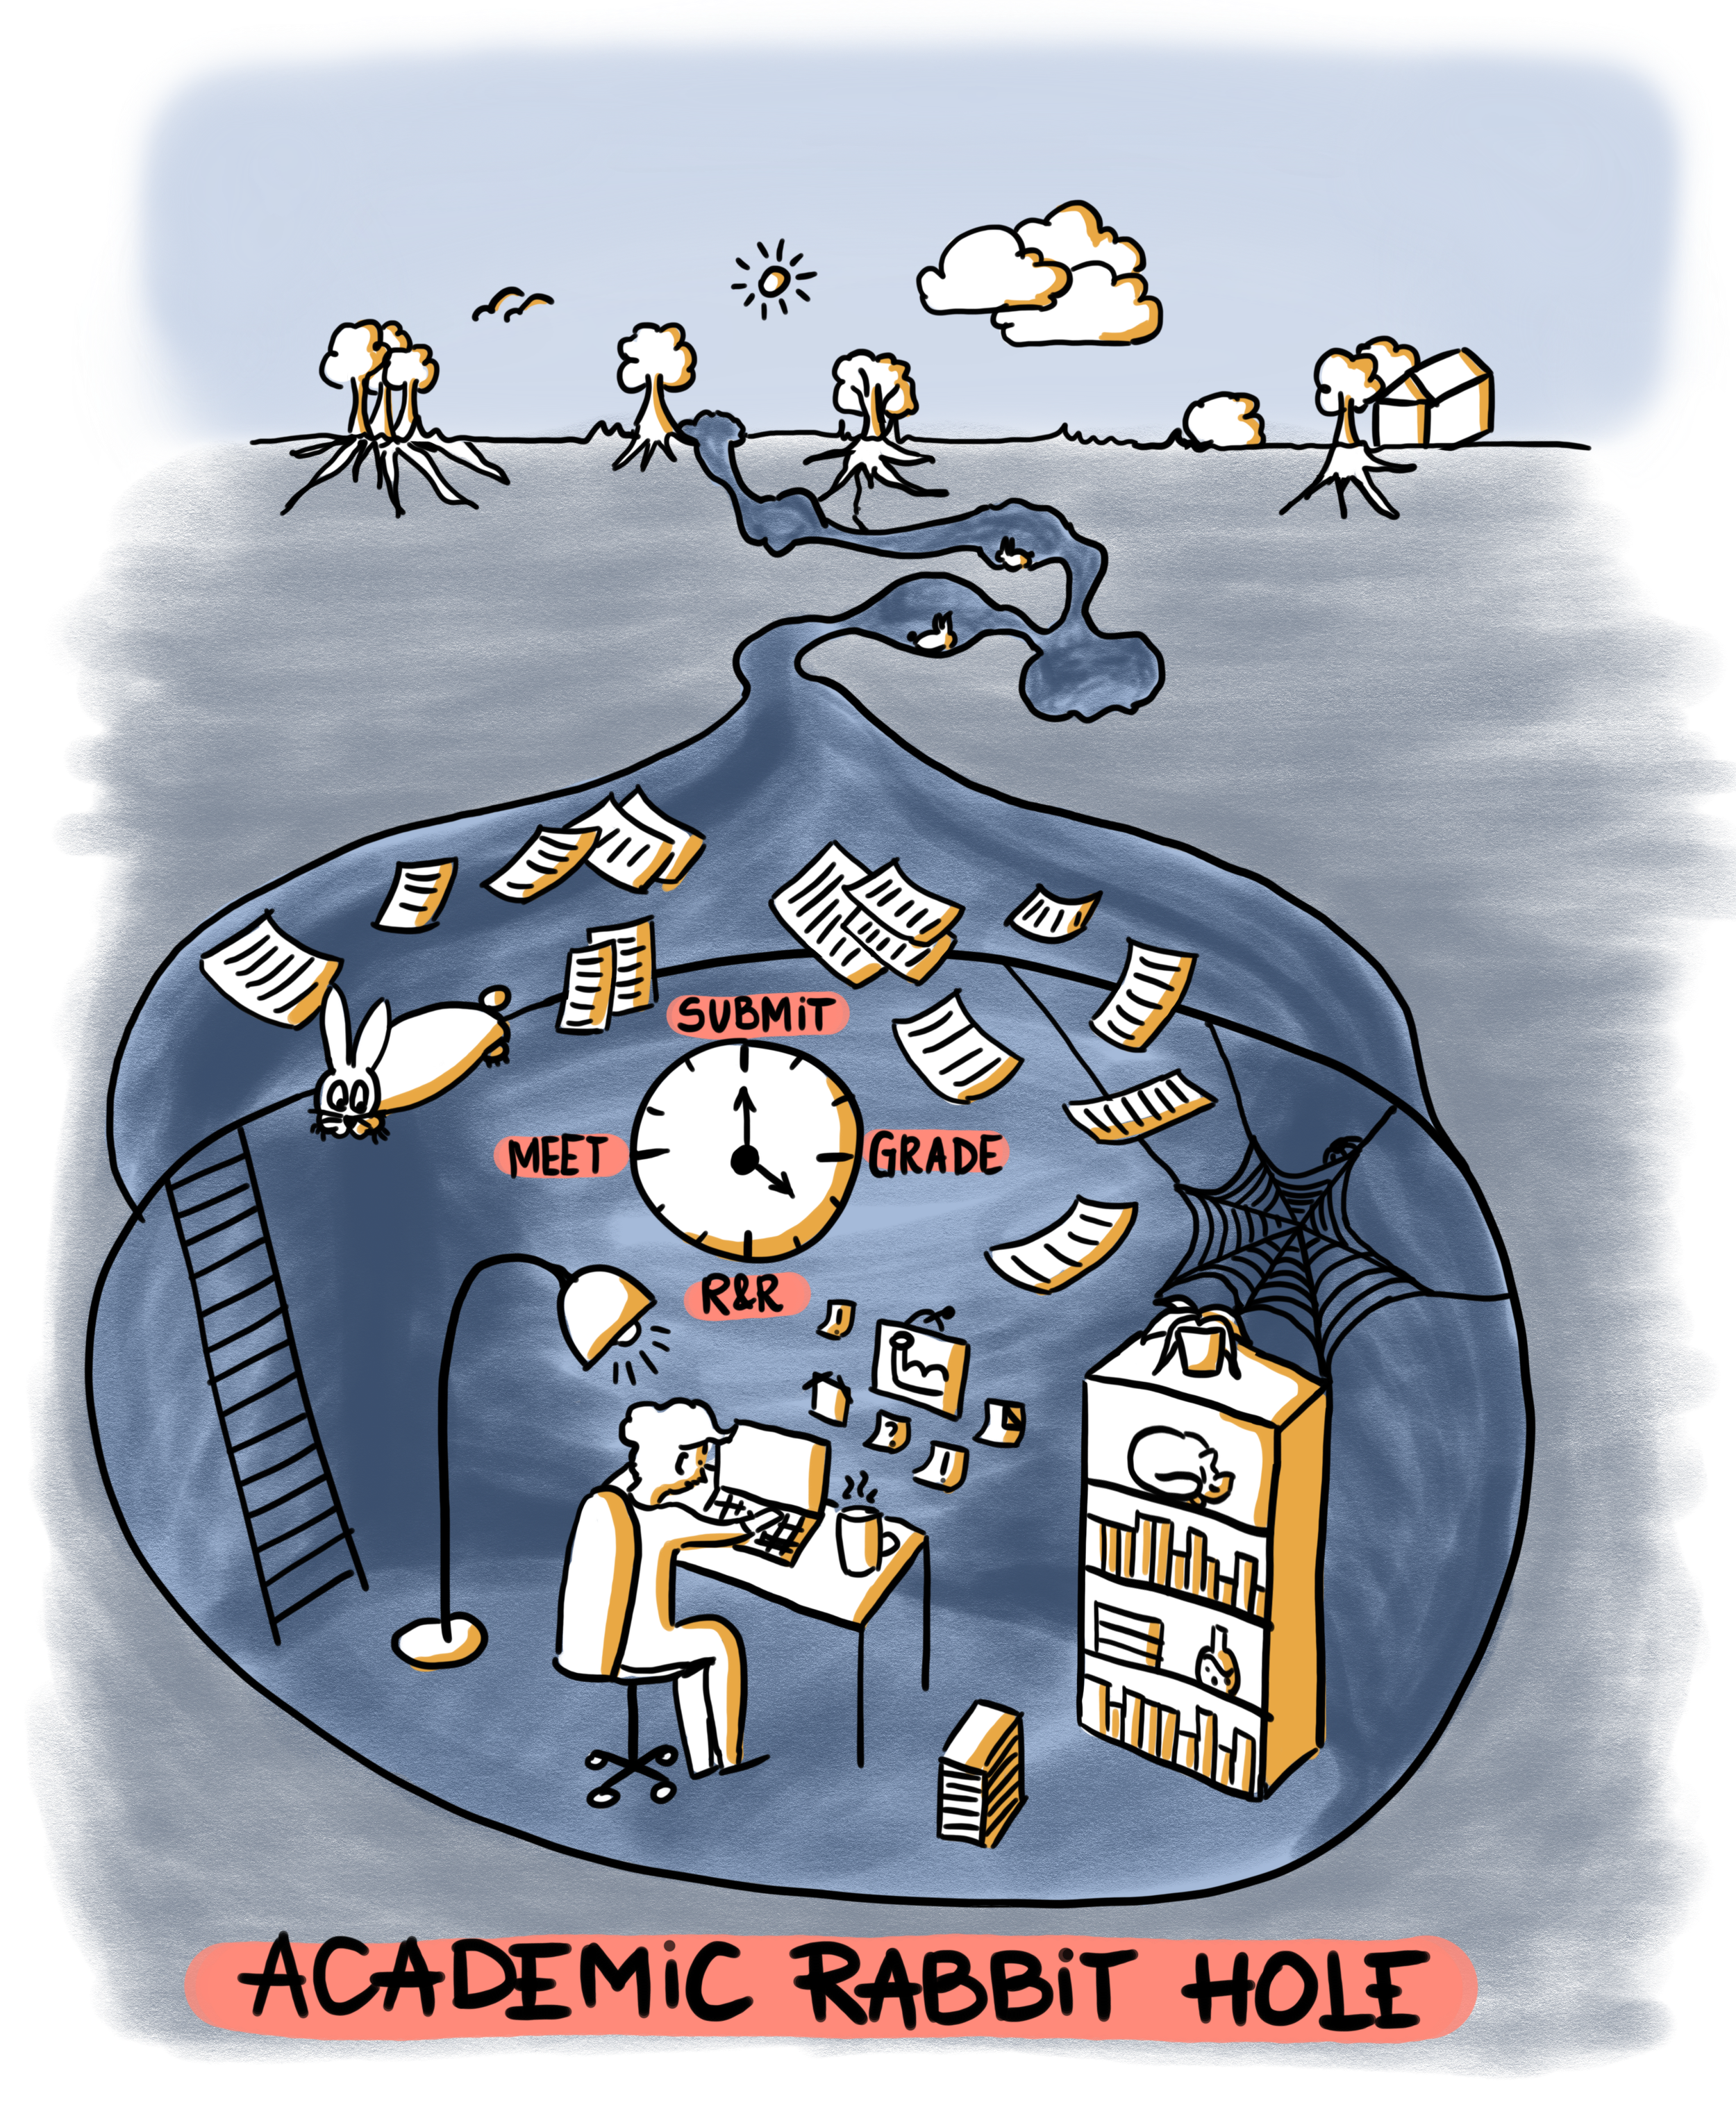
You spent a year, two, sometimes five or more, meticulously conducting your research. Slowly, you dug yourself down into the rabbit hole of literature reviews, fancy new methods, and nerdy statistical models…
You collected the data, then something went wrong - of course it always does, whether on the human side or on the practical side. The project got delayed, and you ended up investing more time than you'd ever planned. You were sinking deeper and deeper into the depths and twists and turns of the hole.
Yes, it was sometimes dark and claustrophobic in that rabbit hole. But in the end, it was YOUR hole - cozy, familiar, and smelling of hard-earned achievement.
Once your project was finished, you faced a choice.
You could spend weeks crafting the perfect explanation for people who weren't down there with you - time you simply don't have between teaching, admin work, and your next research project. Or you could let your brilliant work speak only to the handful of academics who already live in similar rabbit holes.
The result? Your groundbreaking research got trapped in academic limbo, buried in technical language, or simply ignored by the very people who needed to understand it most - not because it wasn't important, but because translating it for broader audiences takes precious time and energy you don't have.
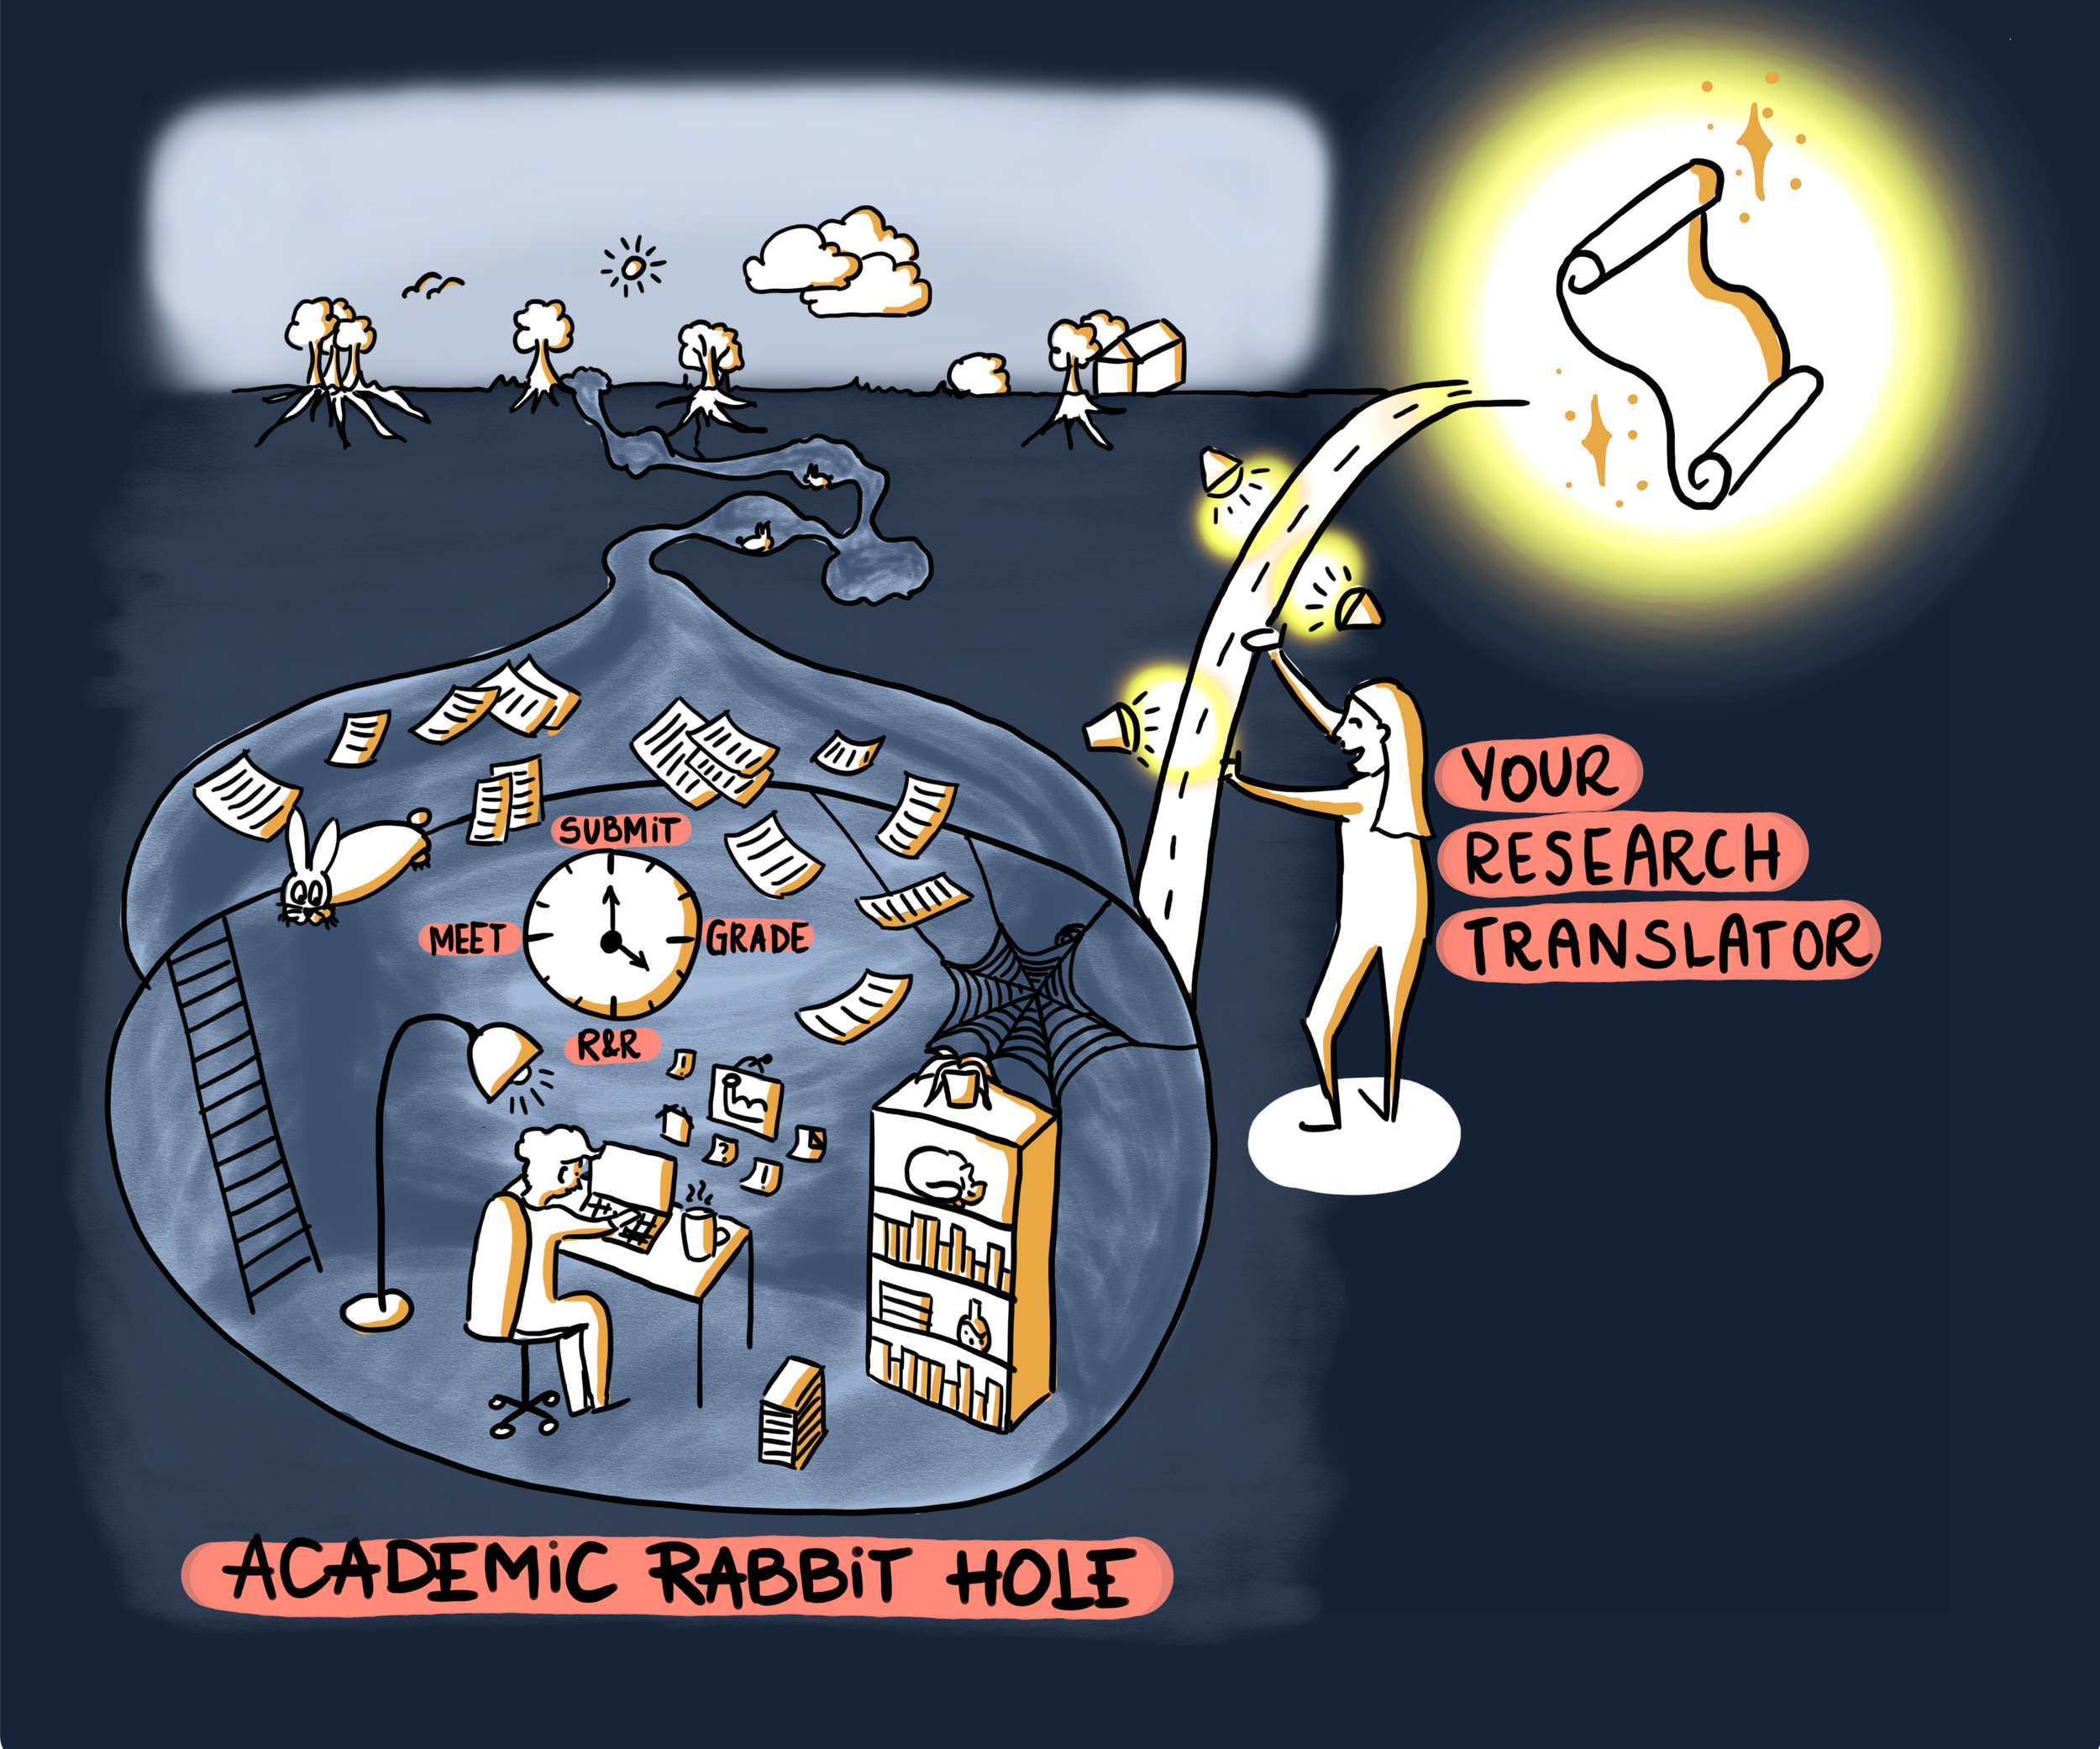
But what if someone dived into the rabbit hole with you,
understood the journey you've taken,
and helped you create a clear path out that others can follow?
Your research deserves to see daylight. And the world deserves to understand it. But you shouldn't have to choose between doing good research and communicating it well. That's where I come in.
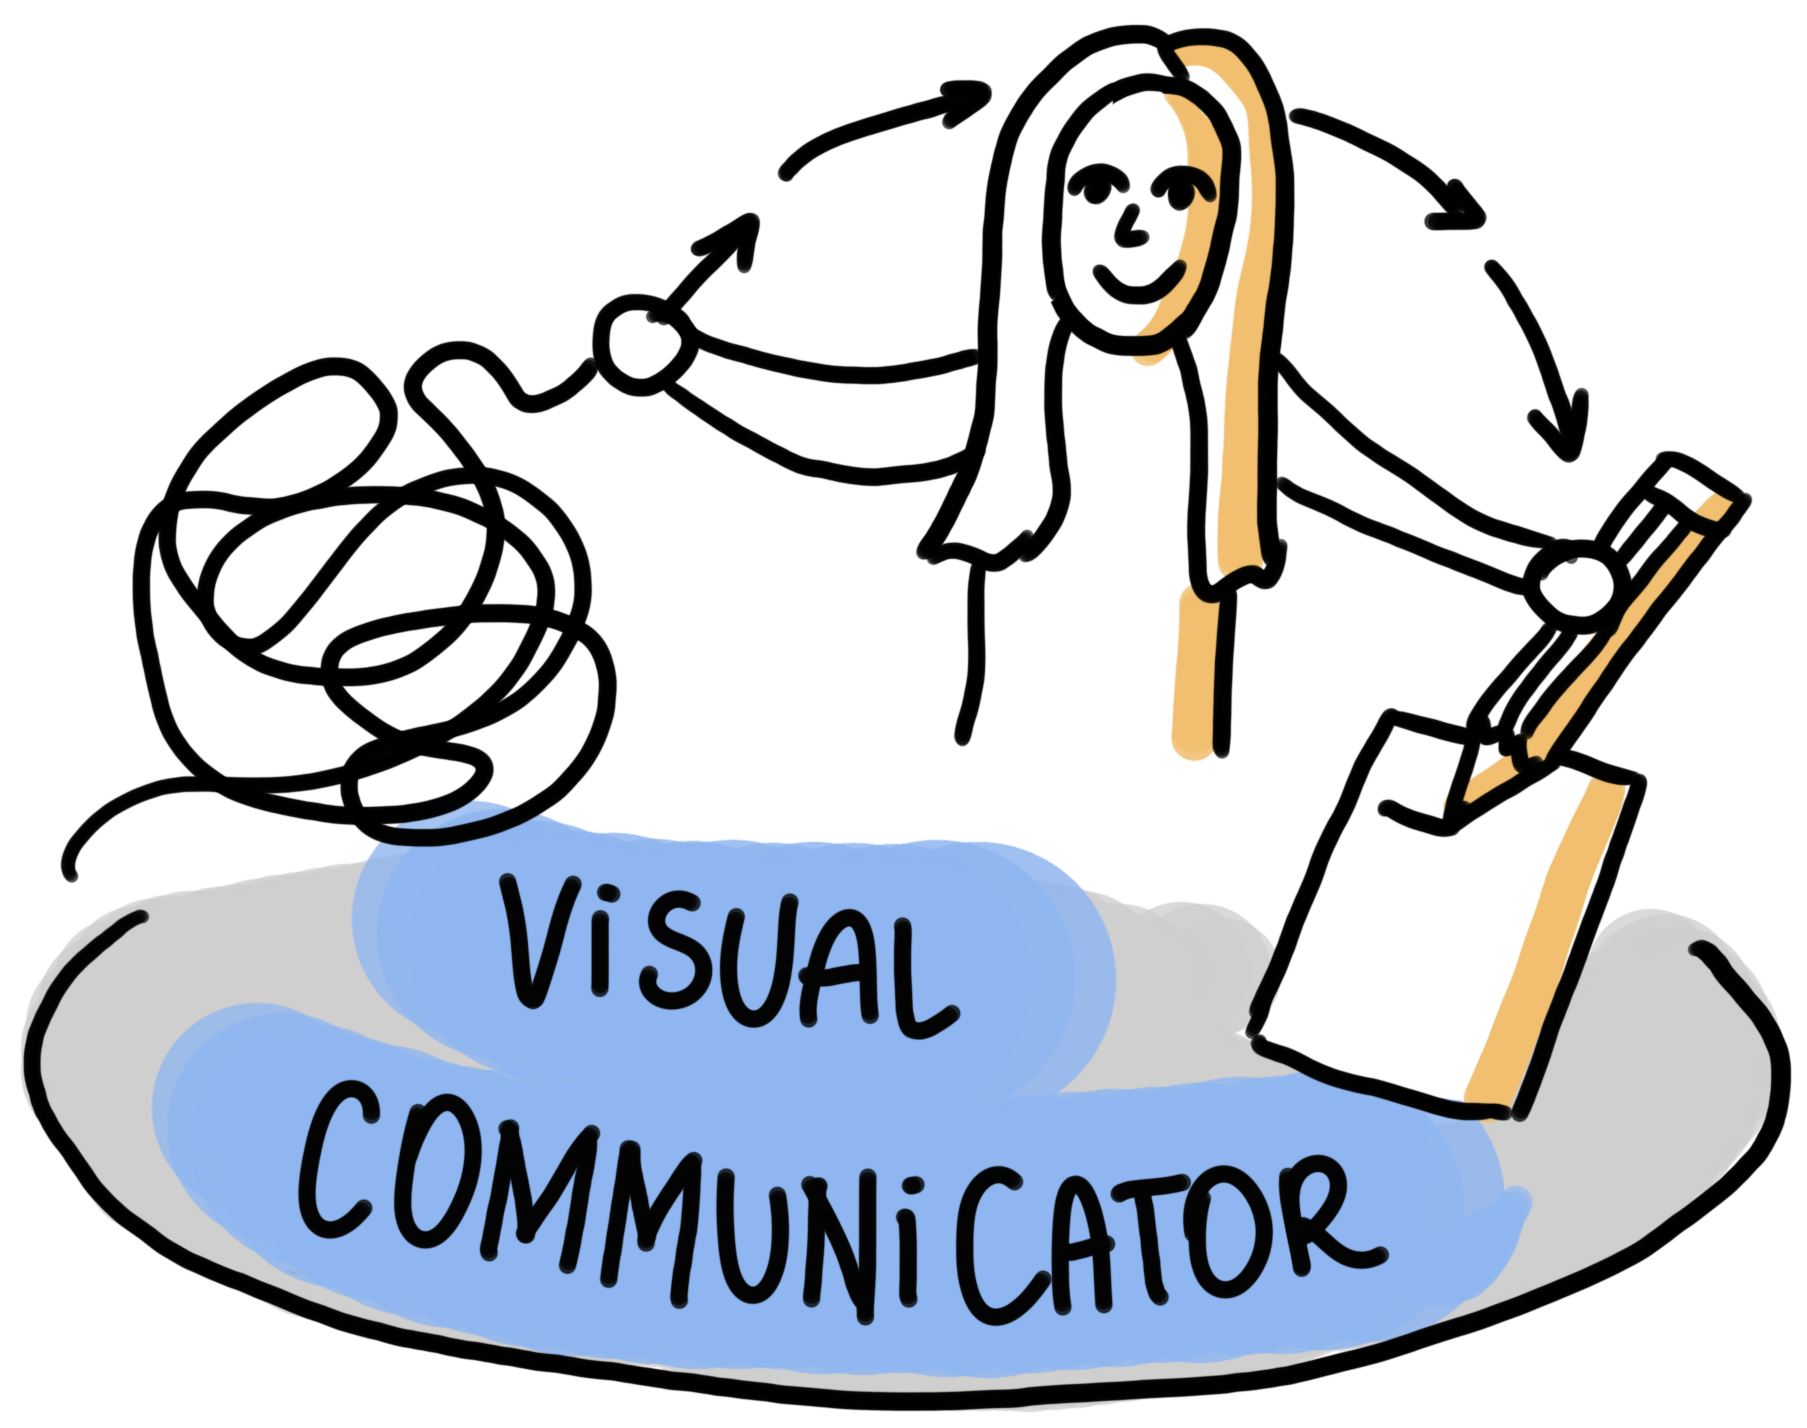
I specialize in translating research rabbit holes into visual stories that connect with the people who need to hear them - without you having to spend weeks explaining every detail. I help you reclaim those weeks you'd spend crafting explanations by transforming your complex work into visual stories that do the talking for you. Think of me as your research translator - someone who speaks both "academic" and "human" fluently.
You focus on the research. I'll handle the storytelling.
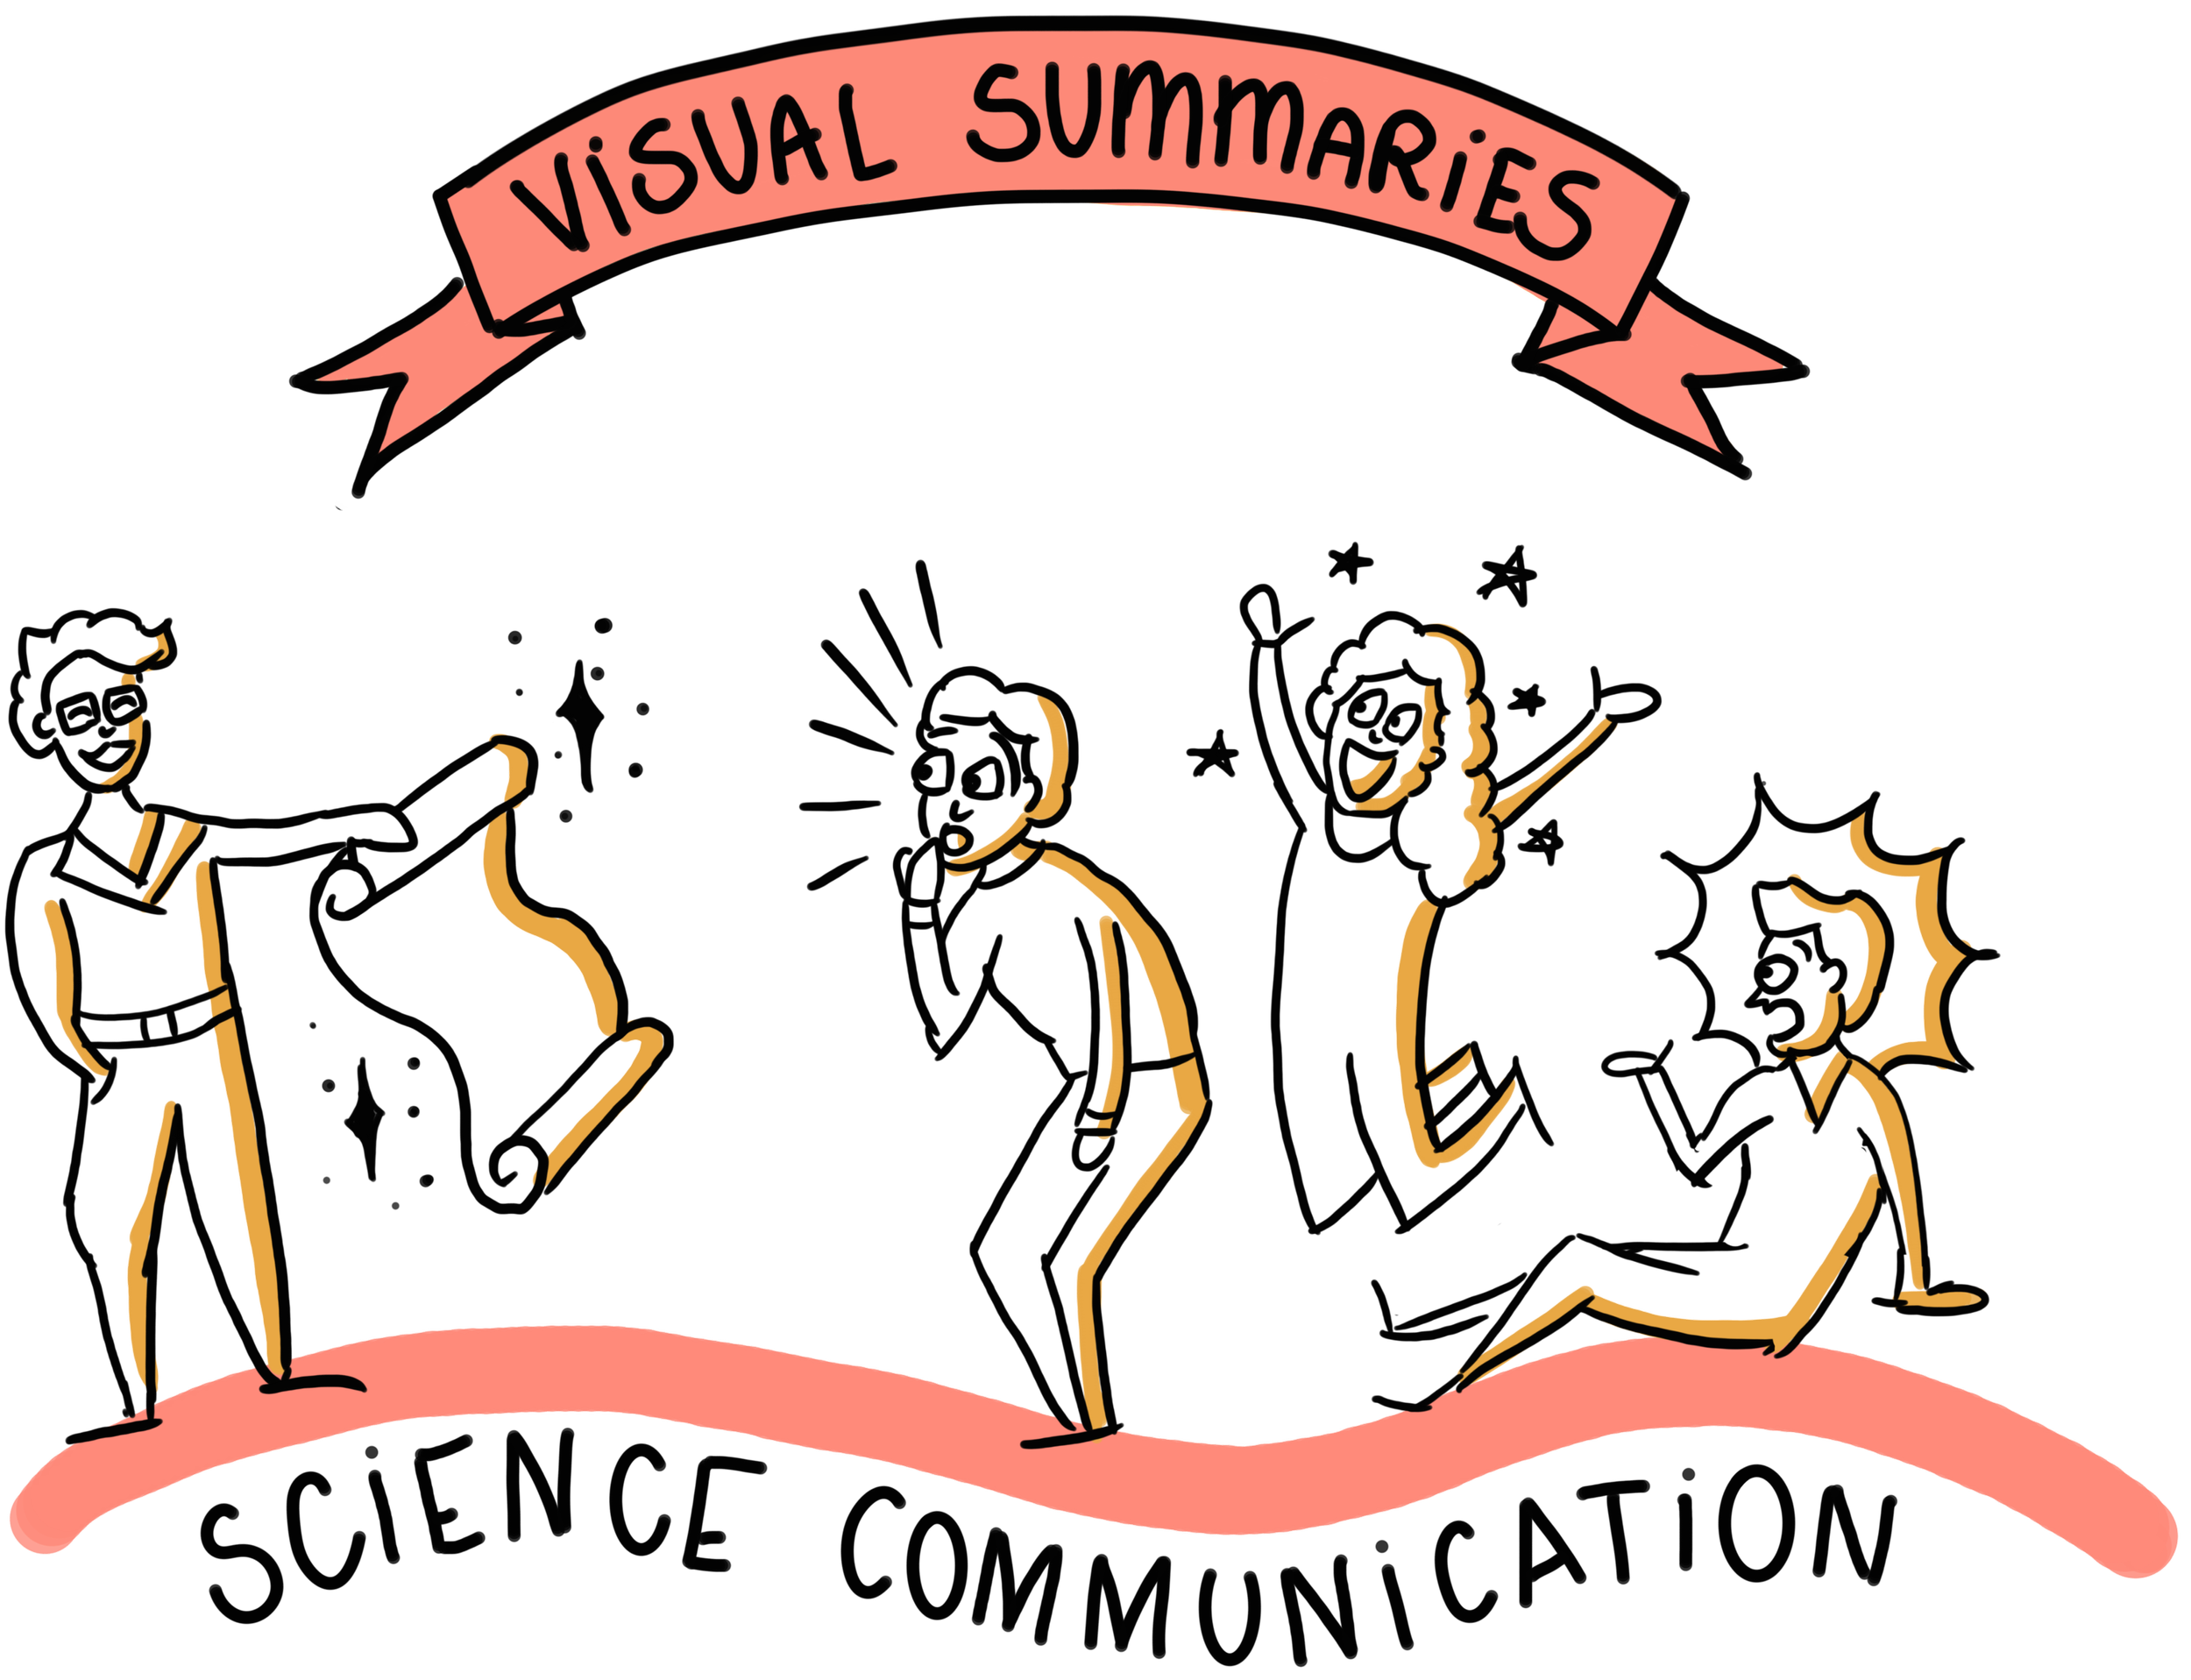
Here's how I help researchers communicate science:

Comissioned Visual Summaries
We discuss your message, I create the visual for you.
✅figures for grant proposals (ERC, NWO, etc.)
✅visual CV and job application materials
✅conference posters
✅visual networking cards
✅teaching materials
✅public outreach visuals
✅social media posts (LinkedIn, Instagram, Facebook)

Visual Summaries for Events
You present, I capture the key ideas in real-time.
✅graphic recording
✅ conference documentation
✅quick 1:1 “Draw My Research” sessions
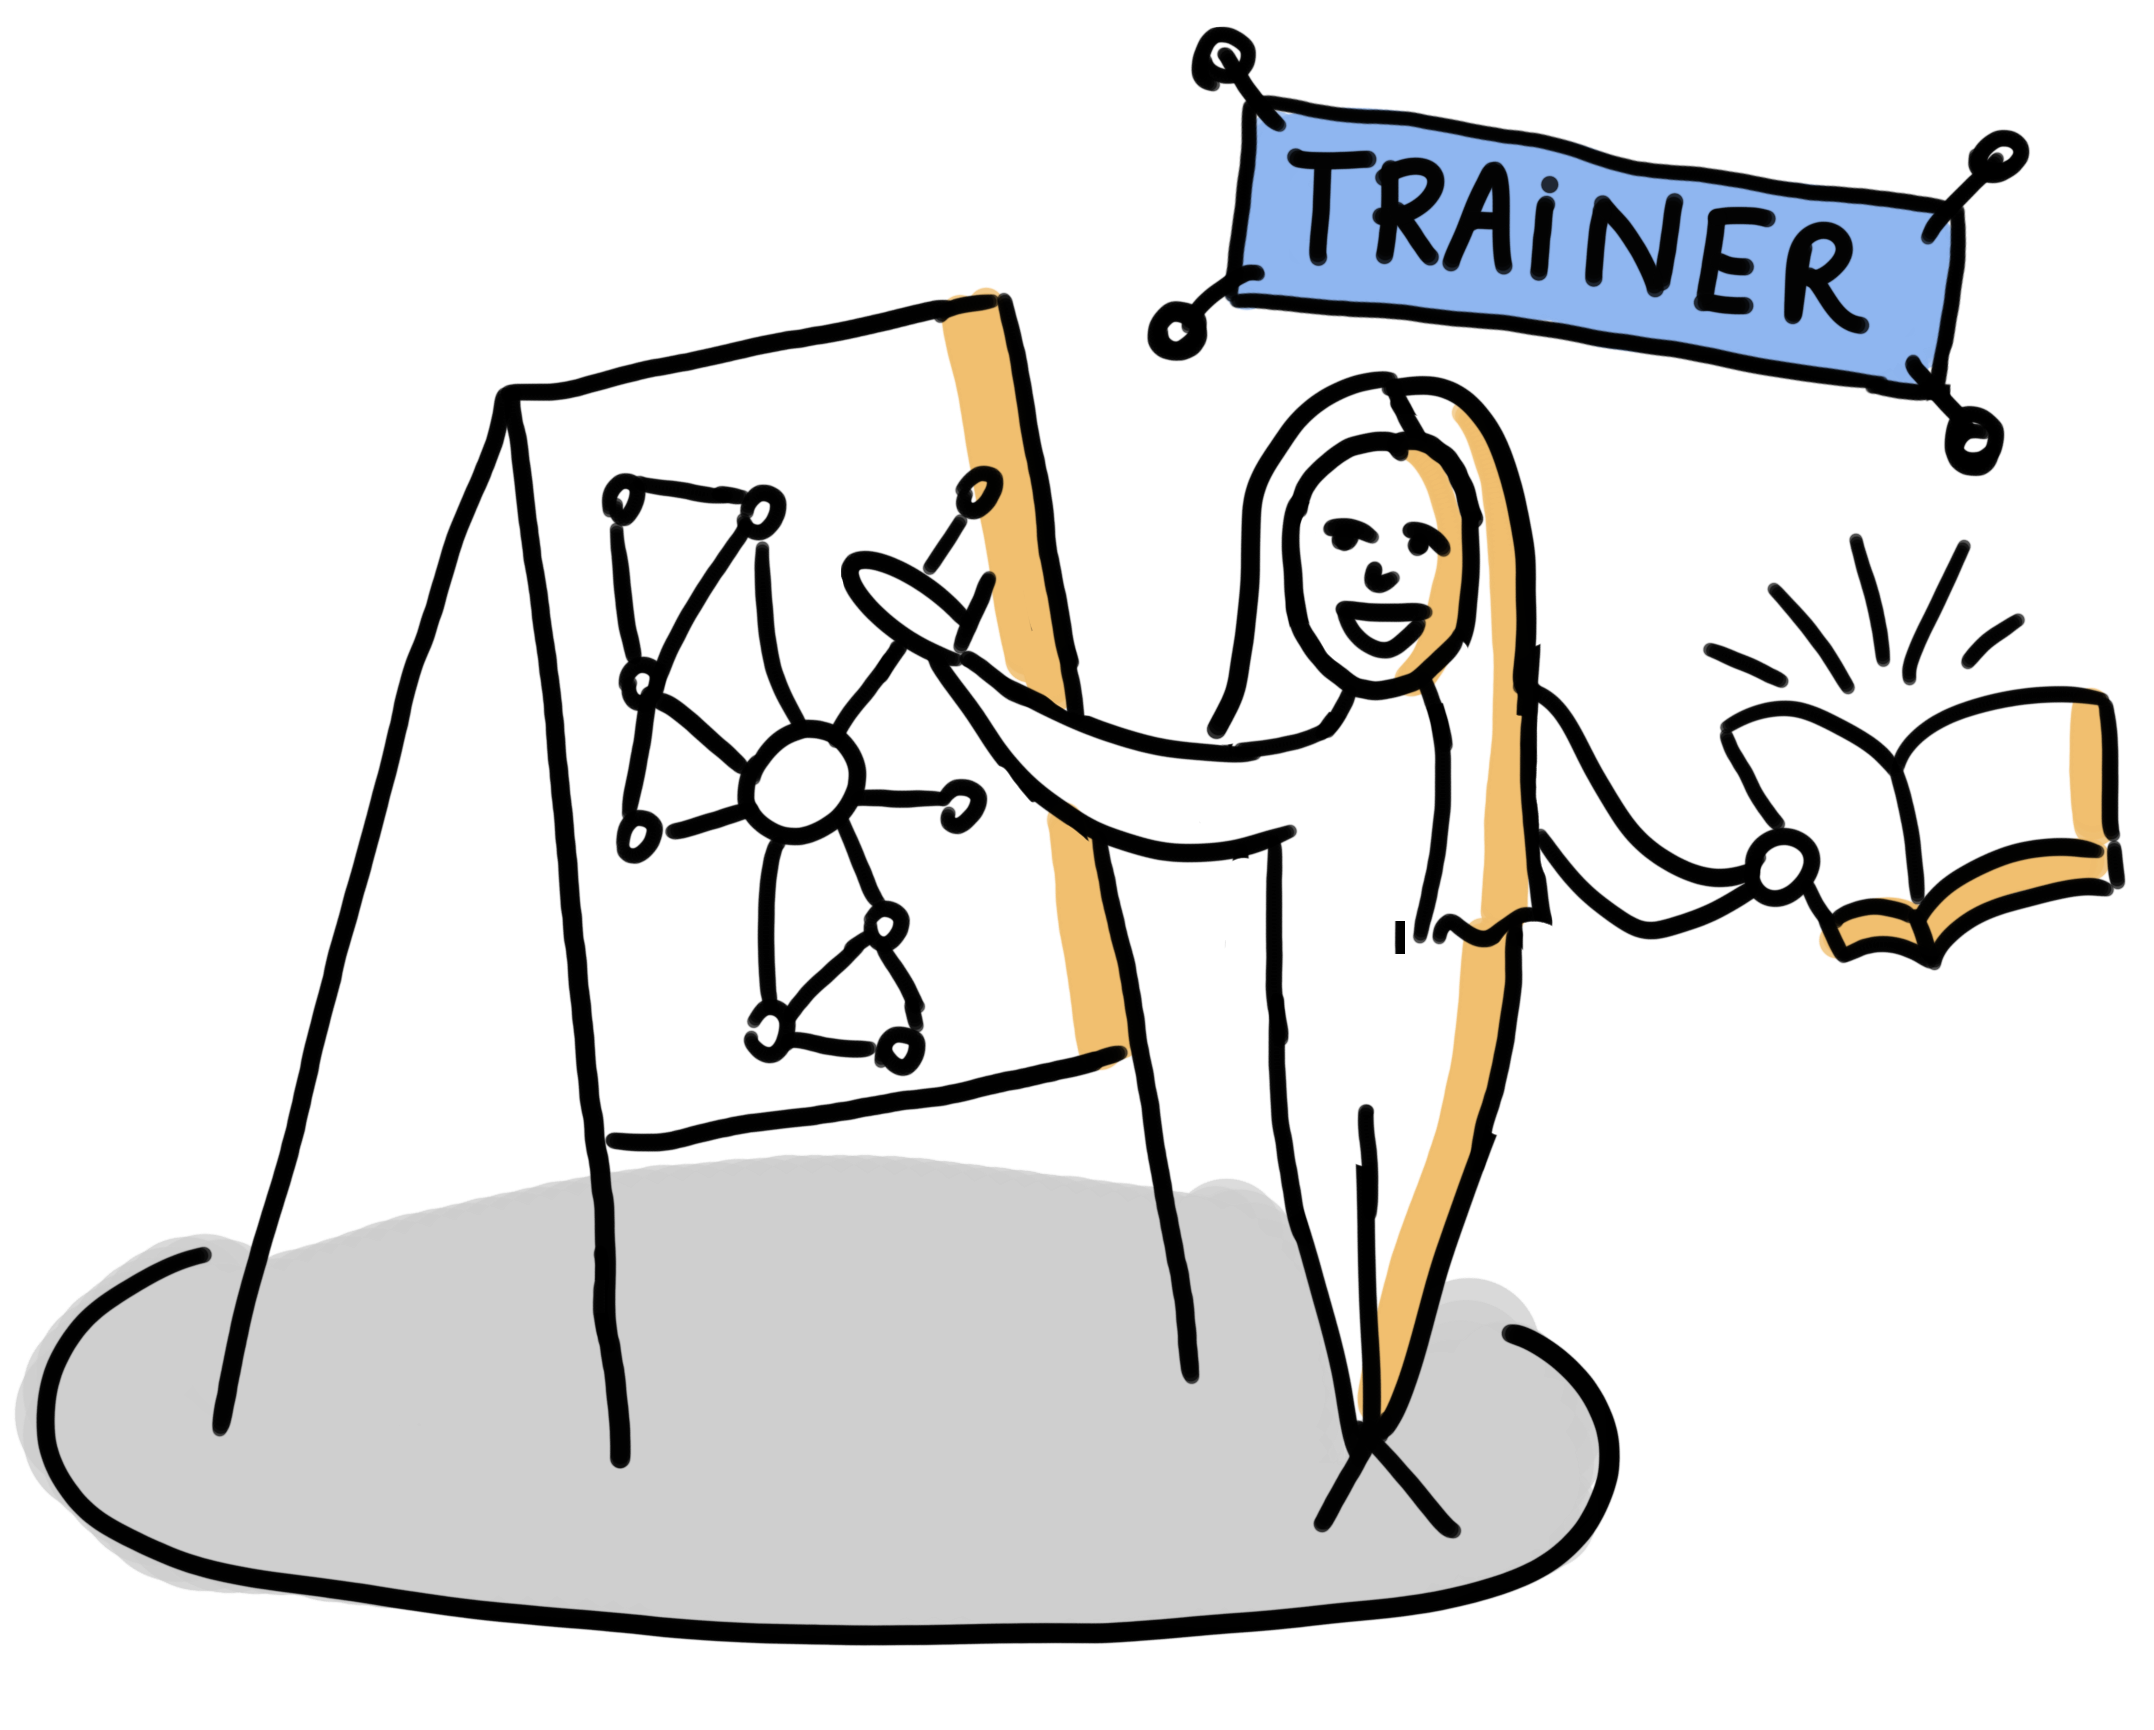
Visual Communication Workshops
I guide you, you learn to create visuals yourself.
✅Visual Science Communication for Online Networking
✅Communicating Science through Visually Engaging Posters
✅Communicating your PhD through Visual Thinking
✅Marketing your Research through Visual Thinking
✅Create your Visual Networking Card
-
![]()
The Atlas Project
-
![]()
The Echo Project
-
![]()
The Brightline Project
-
![]()
The Northgrid Project


Ready for your first visual summary?
